How accurate is Accuracy? How Precise is Precision?
July 24, 2018 | by ojhadiwesh@gmail.com

One of the most common concepts while solving any classification problem in statistics is how accurate the classification turns out. For a long time I assumed the success of any model was accuracy. Let me explain accuracy using a simple classification problem, let’s take the example of a spam classifier where we have to classify an email as either ham (good email) or spam(an actual spam). Let’s assume we have a training set of emails and test set where the classification has been mentioned in the target variable. Using this data set we will train our model, in our model we can use many algorithms that are useful for classification such as Naive Bayes, SVM, etc. But for simplicity we will use NB for our purposes, in spam emails there are a set of words that repeat with certain probabilities. The classifier does not these probabilities and thus we have to train the classifier by using the training set which already has the spam/ham flag marked. Once we have trained the classifier every word will have a likelihood function associated with that word. Then we use the classifier to classify the test set(without spam/ham flag) as spam or not. Accuracy of this model would be the number of correct spams marked out of the test set emails.

This value seems a pretty good estimator of how good the model is, but if we dig deeper would find otherwise. Even if we get an accuracy of 95%, it would not be considered a very good model, because we have just used one class for our model- the number of emails correctly classified as spam (True positives). But it leaves out the number of emails that have been classified as ham but are in fact spam(false Negatives). The statistical term for identifying all the useful cases is called Recall.

Recall = spams correctly identified / (spams correctly identified + spams incorrectly identified as ham)
Now if we classify all emails as spam we will have a recall of 1, seems tempting right but that would fail our purpose. It would create a very low precision in our model.
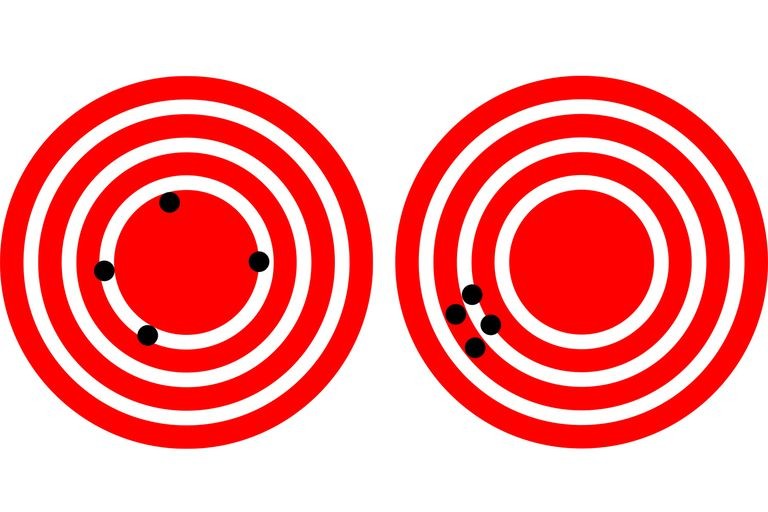
Precision: Gives us the ratio of cases where the number of spam classifications by the model to the actual number of spams in the data.

Precision= spams correctly classified / (spams correctly classified + emails incorrectly labeled as spam)
If we classify all the emails as not spam we would have an high accuracy considering that there are more numbers of hams as compared to spams but that model would have a very low precision and recall. If we identify one email correctly as spam we have precision of 100% (false positives =0, true positives =1), but recall would be extremely low because of high number of false negatives. So a model with only high precision also does not make a lot of sense. If we classify all emails a spam, our recall becomes 1 but precision lowers to almost 0. So there seems to be an inverse relationship between recall and precision.
Fortunately statistics comes to our rescue and gives us a way to combine recall and precision to get a new parameter called balanced F- score. F- score is the harmonic mean of recall and precision.

An F- score gives equal importance to precision and recall both which in some cases leads to bias between classes. To accommodate this, there have been two variations of F measure, F2 score- places more importance on recall than precision and f(0.5) score which gives more importance to precision than recall.
A ROC curve is a very effective to visualize the diagnostic ability of a classifier. It is plotted between True Positive rate (Recall) and False Positive rate (probability of false alarm).

We calculate the Area under the ROC curve, a higher value of AUC tells us that the model is performing well. The other way to visualize classification is obviously through the confusion matrix.

RELATED POSTS
View all


